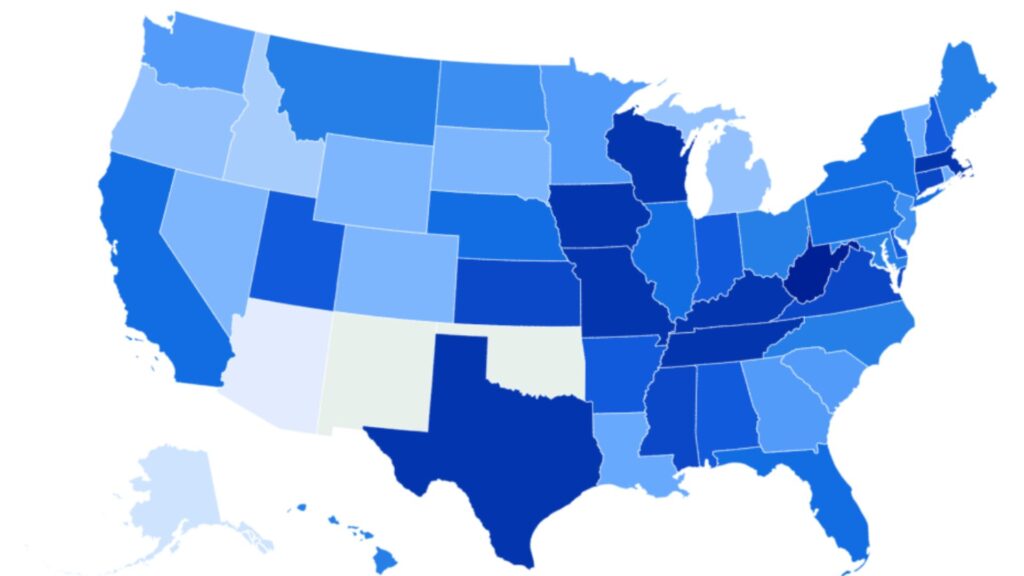
West Virginia has the highest rate of graduation among public high school students, according to data from the National Center for Education Statistics (NCES).
With score of higher than 90 percent, the state led the way on public high school graduation, with Tennessee, Kentucky, Wisconsin, and Massachusetts close behind.
Newsweek has contacted the Department of Education via email for comment.
Why It Matters
High school graduation rates in the country have been on the rise based on NCES data. Between 2011 to 2012, the average adjusted cohort graduation rate (ACGR) for public high school students was 80 percent, but in 2021 to 2022, that number was 87 percent.
While the data shows a rise in graduation rates as a whole, the increase has not been completely steady, with the coronavirus pandemic knocking the average ACGR down slightly.
Following the passage of President Donald Trump’s “Big Beautiful Bill” earlier this month, education experts have voiced concern over what ramifications the wide-reaching legislation could have on children and schools.
Medicaid and Supplemental Nutrition Assistance Program (SNAP) cuts could impact school budgets, experts warn, while the continued mass deportation of immigrants may strain schools as they try to support students whose family members have been detained.
What To Know
The NCES calculated the graduation rates in each state based on an ACGR—the percentage of public school students who graduate within four years of starting ninth grade with a regular diploma.
For students with “the most significant cognitive disabilities,” the score was measured by those with a state-defined alternate high school diploma. There was no available information for New Mexico or Oklahoma.
While there were also other states that had ACGRs of 90, including Texas and Missouri, these states still fell into the category of ACGRs between 80 to less than 90 percent—suggesting these numbers may have been rounded up.
States with the lowest ACGR include Arizona (77 percent), Alaska (78 percent), and Idaho (80 percent). Puerto Rico had the lowest ACGR across the board at 74 percent.
Why the ACGR varies widely between states is multi-factorial. One reason is that states “have their own graduation requirements,” Christopher Lubienski, director of the Center for Evaluation and Education Policy at Indiana University and elected member of the National Academy of Education, told Newsweek.
For example, up until this school year, students in Massachusetts had to pass state-administered tests in English, mathematics, and a science in order to graduate, Richard Murnane, a professor of education and society at the Harvard Graduate School of Education, told Newsweek. “This is no longer the case, so Massachusetts graduation rates will be higher this year.”
Graduation rates may also vary due to the differences in numbers of private schools in states.
“In some states with fewer private schools, most students go to public schools, so the ACGR there is more of a reflection of the total school population,” Lubienski said. “But in other states where many students go to independent schools, it could be that the students most likely to complete school enroll in those non-public options, leaving public schools with more students who are less likely to complete school.”
These factors make it difficult to make accurate conclusions on what the ACGR says about education in each state, Lubienski told Newsweek.
Broadly, factors that cause variation in education outcomes in states include “family incomes,” Murnane said, pointing to Massachusetts as “a quite wealthy state.”
He also said that high school graduation rates depend on the percentage of students who are immigrants.
“Many immigrants come with low English skills and have trouble doing high-school-level work. Others move back to their original countries before they graduate,” Murnane said.
He added that “when and where the economy is very strong, drop out rates tend to be higher because students leave school to take jobs.”
What People Are Saying
Christopher Lubienski, director of the Center for Evaluation & Education Policy at Indiana University and elected member of the National Academy of Education, told Newsweek: “A more useful number would be looking at this issue over time. Assuming that a given state has maintained its same graduation requirement, changes over time would give us some indication as to whether schools are performing better or worse.”
He added: “Students are more likely to successfully complete school if they attend a well-resourced school, and have suitable family, community and school support systems in place.”
Richard Murnane, a professor of education and society at the Harvard Graduate School of Education, told Newsweek: “States differ in how well they track high school graduation rates. The data comes from individual high schools. High schools have incentives to state that students who leave prior to graduation have ‘transferred’ to another school rather than state they have ‘dropped out.’ Some states check on the accuracy of the reports from individual schools much more carefully than other states do.”
Mavis Sanders, a senior research scholar of Black Children and Families at Child Trends, nonprofit, non-partisan research organization, told Newsweek: “Graduation rates are complex outcomes shaped by a variety of factors, including the availability of jobs and career opportunities for individuals without high school diplomas, graduation requirements which differ by state, as well as specific supports and pathways to graduation—such as those implemented in states like Tennessee.”
She added: “Graduation rates also vary significantly across student groups and are influenced by factors such as socioeconomic status, race and ethnicity, and English language proficiency. As such, graduation rates reflect broader issues of educational access and opportunity.”
Read the full article here
