


In trading on Friday, shares of The Cigna Group crossed below their 200 day moving average of $340.21, changing hands as low as $338.60 per share. The Cigna Group shares are currently trading off about 3.8% on the day.
Start slideshow: 10 Stocks Crossing Below Their 200 Day Moving Average »
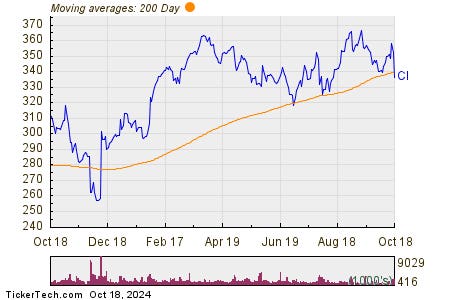
The chart below shows the one year performance of CI shares, versus its 200 day moving average:
Looking at the chart above, CI’s low point in its 52 week range is $253.95 per share, with $370.825 as the 52 week high point — that compares with a last trade of $338.49. The CI DMA information above was sourced from TechnicalAnalysisChannel.com
For more on Top Dividends click HERE
Read the full article here


