


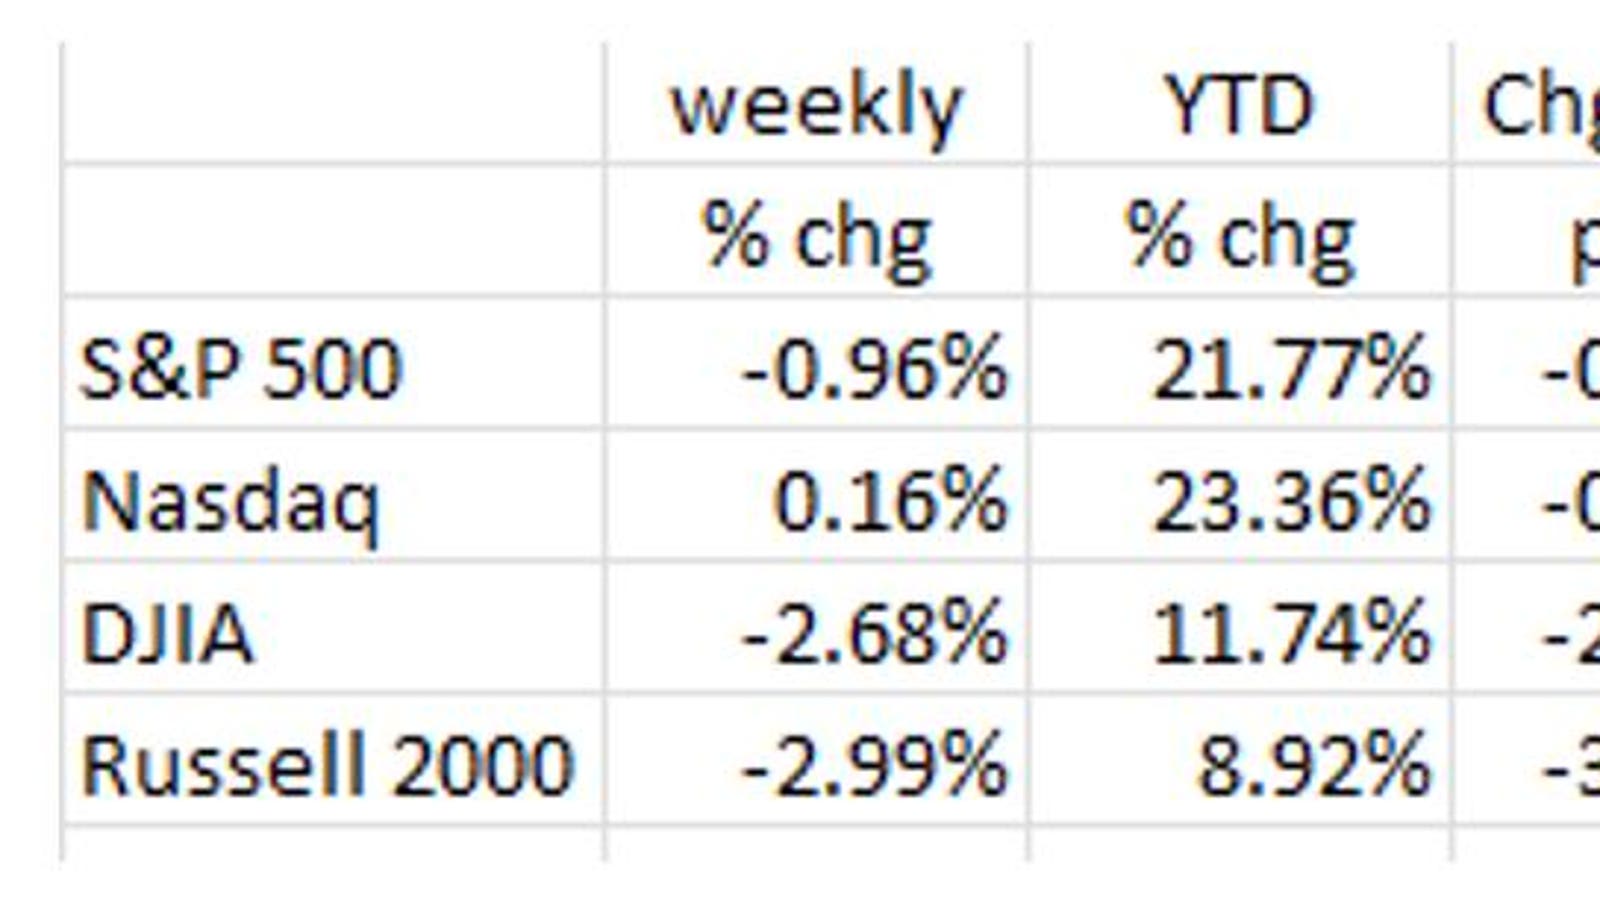
It was a down week for most of the major indexes with only the Nasdaq managing to keep its head slightly above water. It’s likely that the back-up in interest rates played a major role with the 10-Year Treasury yield spiking to close at 4.24% on Friday (October 25th), up from 4.08% a week earlier.
Four of the Magnificent 7 managed a positive week with Tesla up nearly 22% to a new record high because of its positive earnings quarter and upward guidance from CEO Elon Musk. Nevertheless, the major market averages appear to be reassessing the path forward, and, as we outline below, with good reason.
“Soft” or “No” Landing?
The consensus forecast for the U.S. economy continues to be a “soft-landing,” i.e., some slowdown in economic activity but no Recession. Some forecasters are even saying “no landing,” meaning the 3%+ recent GDP growth rates will continue. We aren’t convinced, as the incoming macroeconomic data appears to be at odds with the less aggregated data, surveys, and sentiment. For example, recent retail sales (September) indicated rising consumption of food away from home (i.e., at restaurants). That’s in stark contrast to the headline on the front page of the October 22nd Wall Street Journal: “Empty Tables, High Costs Push Restaurants Into Bankruptcy.” This year, apart from 2020, restaurant chains are on course to have the most bankruptcies in decades.
“The list of restaurant chains declaring bankruptcy in 2024 include Red Lobster, Hawkers, Asian Street Food and Tijuana Flats. 13 restaurant companies that are either publicly traded or have $10 million in liabilities have filed for bankruptcy so far this year, up from four in 2023 and tying the total for all of 2023.” – Owen Klinsky @ Daily Caller
That’s only one of several indicators at odds with macroeconomic data. Last month’s Non-Farm Payroll +254K growth in jobs is another. Taken at face value, that number would appear to indicate that the job market is “strong.” But, broken down further, government jobs (federal, state and local) grew +785K, leaving the private sector with a -531K loss. Other recently released data also indicate that the economy is slowing:
Industrial Production has been flat or negative since early 2023.
The Richmond Fed’s Manufacturing Index recorded -14 in October vs. -21 in September. The index has been in negative territory for 12 months in a row. Looking at sub-categories: Shipments (-8), Employment (-17), New Orders (-17), Backlogs (-14) and Capex (-23) were all quite weak.
Then the Kansas City Fed’s Manufacturing Index showed up as -4 in October, better than September’s -8, but still showing contraction. Like in Richmond, the details were underwhelming: Production (0), Employment (-2), New Orders (-5), Backlogs (-14) and Inventories (-3). To say the industrial economy is in Recession appears to be an understatement!
Finally, The Chicago Fed’s National Activity Index (NAI), a comprehensive index composed of 85 national variables, showed up as -0.28 in September, negative now for four months in a row.
It’s a similar story for housing starts, below ‘21 and ‘22 levels for the better part of ’23 and ’24. Worse, building permits, a leading indicator of new housing starts, have also stagnated likely due to the uptrend in rental vacancy rates.
Existing home sales were also down, falling -1.0% from August to September and down -3.5% for the last 12 months. September’s sales were at the lowest monthly level since October 2010. On the front page of Thursday’s WSJ, the headline read: “Falling Home Sales Are On Track For Their Worst Year Since 1995.” Such sales have been on the decline since 2021, no doubt due to the rapid rise in interest rates engineered by the Fed.
For the month of September, median home prices fell -2.3% and have fallen for three months in a row. And time on the market increased to 28 days in September from 21 days a year earlier. The “Wealth Effect” is a powerful force when it comes to consumer spending. When consumers feel wealthier (rising stock prices, rising home prices), they are likely to spend more and save less, and vice-versa! So far, the equity market has held up, but for how long? And it seems clear that home prices have peaked for this cycle.
The Leading Indicators
The Conference Board’s Leading Economic Indicators (LEI) showed up at -0.5% in September from their August reading. This is the 7th consecutive negative reading. The Index is down -4.8% from a year earlier, and, as shown on the chart, that year/year percentage change hasn’t been positive since mid-2022. The Coincident Economic Indicators still showed up as positive in September (+1.4%), and while that means that the economy is still growing, the LEI indicate that the future road may be rocky. Here’s some food for thought: In January ’08, LEI was -4.9% year/year (quite similar to today’s -4.8%). The Coincident Indicator was +1.5% (again like today’s +1.4%). What happened next? The Great Recession! Further back, in February ’01, the LEI was -5.0% year/year, and the Coincident was +1.7%. Again, a Recession was not far off.
Q3 Earnings
We are currently midway through the Q3 publicly traded corporate reporting period. Given the 3%+ GDP growth rate, one would think that U.S. companies are doing well. On the contrary; there have been some surprises:
- Starbucks, a bellwether of the American consumer, reported that sales were down -7% from Q3/’23, and they suspended guidance for 2025;
- Hilton lowered full year profit and revenue citing softness in travel demand;
- Coca-Cola saw a -1% year/year sales decline;
- Kering, the French luxury goods company that owns the Gucci brand, lowered its earnings outlook and indicated that profits are the worst since 2016 and that same store sales are off -25% for its Gucci products;
- Winnebago cited weak RV sales;
- Volvo indicated lower sales and cut their full year guidance;
- Even beer maker Heineken cited weaker sales;
- And Discover Card said that card transactions were -3% lower than in Q3/’23.
Goldman’s 10-Year Forecast
So, it wasn’t a big surprise to us when, in mid-October, Goldman Sachs updated their long-term forecast for U.S. equities to an annualized return of 3% per year over the next decade! That annual growth forecast would put the next decade of growth into the lowest ten percentile of growth by decade since the 1930s. Compare that 3% growth rate to the 13% per year growth over the last 10 years.
Market watchers know that the S&P 500 is up more than 20% year-to-date and nearly 40% from a year ago. Yes, corporate earnings are growing, and this justifies higher stock prices. But those earnings are only growing 5%-6% per year. The price/earnings (P/E) ratio, a proxy for earnings growth, now sits north of 22x. Its long-term norm is around 16x. Earnings growth will have to be higher than 5%-6% to continue to justify that P/E ratio.
Goldman’s forecast, looked at from this perspective, is that what has happened over the past one year (+40%) will take another 10 years to replicate. Whether this happens at a slow pace or via a market “correction” is anyone’s guess. But what it does say is that bonds, now yielding 4.24% for 10-Year Treasuries and 5.19% for A-rated Corporates, are likely to outperform equities over Goldman’s 10-year horizon.
Final Thoughts
The equity markets were flat/down for the week, no doubt due to the back-up in interest rates as the bond market has apparently reassessed the path forward for the economy, now concluding that there will be a “soft-landing,” or maybe “no-landing” at all.
Yet, despite those sentiments, and despite the macroeconomic data from Washington, D.C., indications from the private sector aren’t as rosy:
- The number of restaurant chains declaring bankruptcy is the highest in decades; that says something about consumer spending.
- Industrial Production is flat as a pancake and has been so for nearly two years.
- Indexes from the Richmond and Kansas City Federal Reserve Banks relating to the Industrial Economy, and the Chicago Fed’s more comprehensive national economic index all say that private sector growth has stagnated.
Housing, an important economic segment, has also stagnated. Existing Home Sales continue to show weakness, new starts are on a downtrend, and building permits, a leading indicator for new housing starts, are all below pre-pandemic levels.
Then there is the Conference Board’s Leading Economic Indicators. They have been negative every month for two years running. While some economists might say we are in a “new economic era,” we are not ready to say that the economic cycle is gone.
Enter Goldman Sachs. Even that sell-side firm sees very low equity returns over the next decade, implying that today’s starting point for equities is significantly above the long-term trend. No doubt they expect some trend reversion, and they clearly don’t believe that the economic cycle is an antiquated concept from the past.
(Joshua Barone and Eugene Hoover contributed to this blog.)
Read the full article here


