


With the election day just over a week away, and early voting now well underway, inflation and the economy have consistently featured in polls as top concerns for voters.
A recent study has shown that in recent months, some parts of the country have experienced steeper rates of rising prices than others.
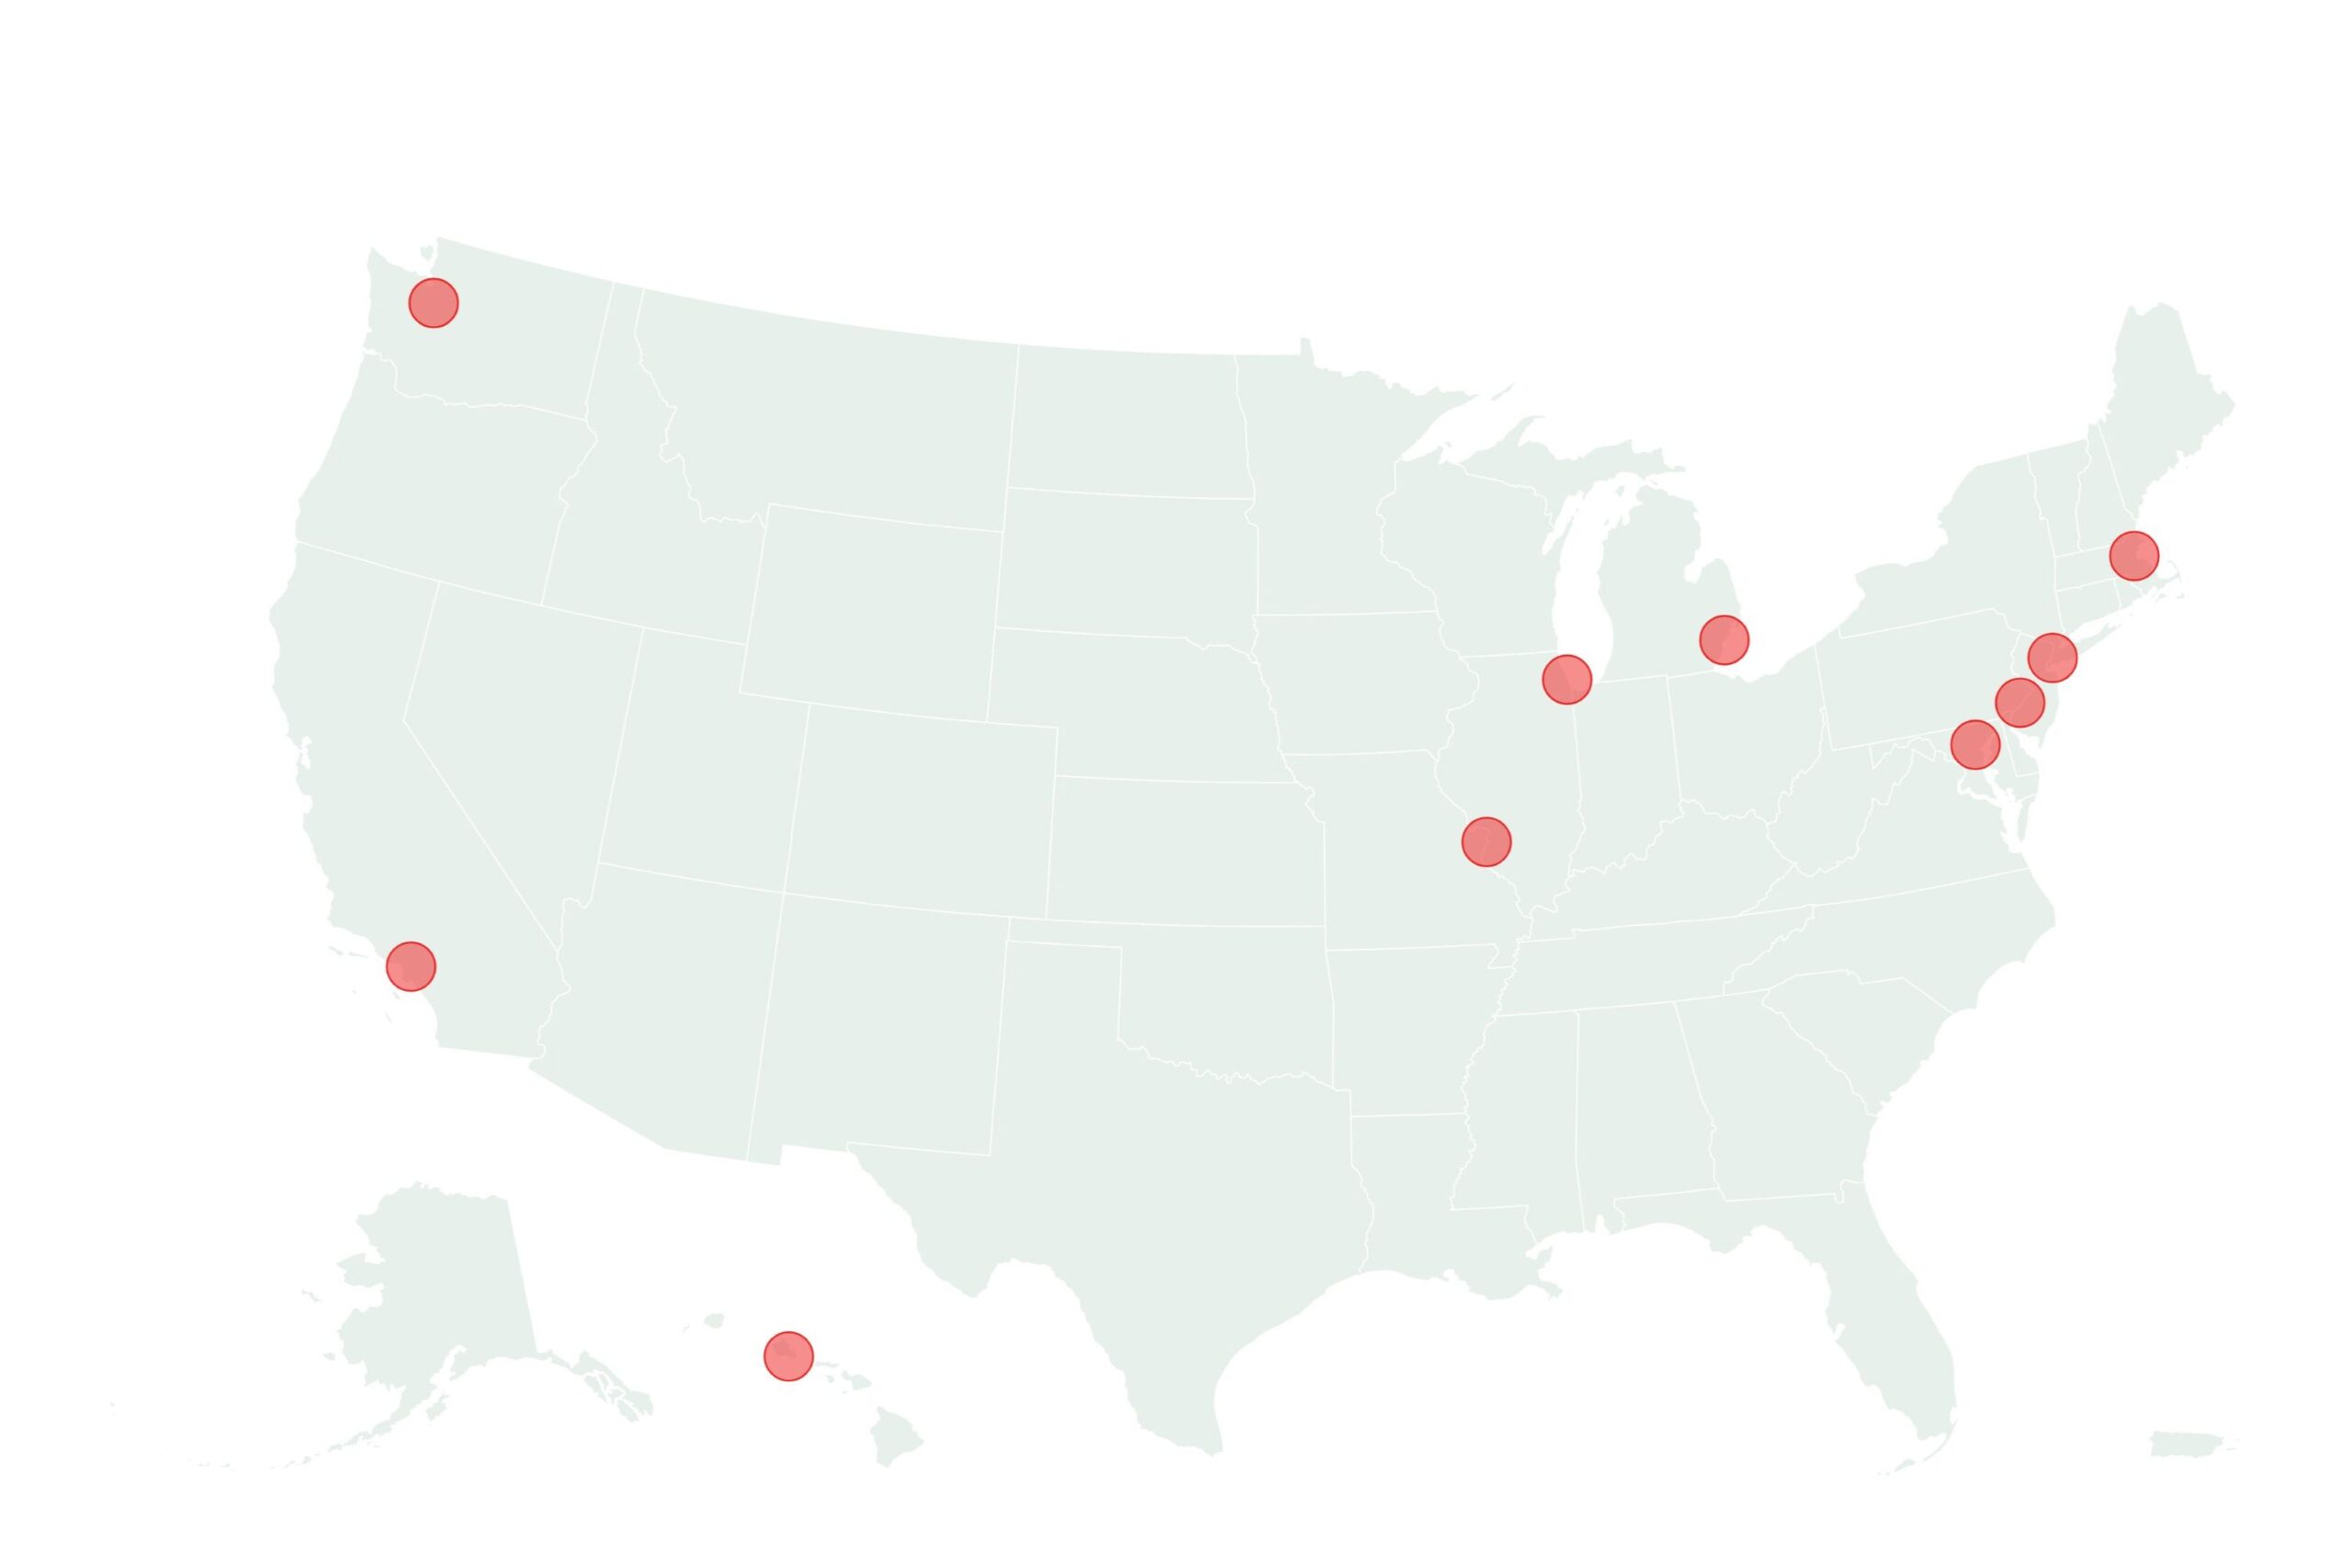
Newsweek has mapped the U.S. metro areas with the highest inflation rates, according to an October report from WalletHub.
WalletHub compared 23 metropolitan areas across the Consumer Price Index (CPI), which measures inflation using the latest available data from the Bureau of Labor Statistics, to glean insight into how inflation was impacting different parts of the country.
The change in CPI between the latest month and the previous two months was measured, as well as the latest month compared to one year ago. A weighted average was calculated based on these figures and each area was awarded a score in order to rank them.
Of the 23 examined, the 10 metro areas with the highest inflation rates were:
- Urban Honolulu, HI
- Chicago-Naperville-Elgin, IL-IN-WI
- New York-Newark-Jersey City, NY-NJ-PA
- Detroit-Warren-Dearborn, MI
- Boston-Cambridge-Newton, MA-NH
- Philadelphia-Camden-Wilmington, PA-NJ-DE-MD
- Baltimore-Columbia-Towson, MD
- Los Angeles-Long Beach-Anaheim, CA
- St. Louis, MO-IL
- Seattle-Tacoma-Bellevue, WA
Urban Honolulu ranked first with a score of 96.51. The Metropolitan Statistical Area (MSA) felt a 0.7 percent rise in the CPI in the space of two months, but a 4.2 percent rise in the past year.
Chicago-Naperville-Elgin experienced the same rise in a two-month space, and a 4.1 percent rise, year on year.
The New-York-Newark-Jersey City area also had the same two-monthly rise, but its CPI change in the past year was slightly lower, at 3.8 percent.
WalletHub analyst Chip Lupo told Newsweek it was clear from the report that there is a steady increase all over the country.
“For example, the top three MSAs: Urban Honolulu, Chicago-Naperville-Elgin, and New York-Newark-Jersey City, are dealing with a 0.7 percent increase in inflation compared to two months ago. They’re also looking at a three to four percent growth since last year.
“This increase could be attributed to factors such as a rising demand for housing, increased costs of goods and services, supply chain disruptions, and higher wages,” Lupo said.
“On the other hand, the bottom three MSAs: Riverside-San Bernardino-Ontario, Anchorage and Tampa-St. Petersburg-Clearwater, are seeing little or no change in inflation. Even more so, the one percent growth compared to the previous year is hardly significant. Tighter monetary policies implemented by local or state representatives such as slowing wage growth, supply chain upgrades and improvements in economic security help with stabilizing prices.”
Newsweek has previously mapped the states where mortgage rates are increasing the most and the “greenest” cities in America.
Do you have a story we should be covering? Do you have any questions about this article? Contact LiveNews@newsweek.com
Read the full article here


