


Historical Bull and Bear Setups
The S&P 500 has had a strong rally from its April 7 intraday low of 4,835. As of intraday Thursday, May 8, the market has moved up towards 5,700 and is approaching its 200-Daily Moving Average (DMA) at 5,748. A move above the 200 DMA would be a bullish signal and increase the odds that a new bull run has begun. Given this, we think it is a good time to re-circulate our work on U.S. market corrections and bear market rallies.
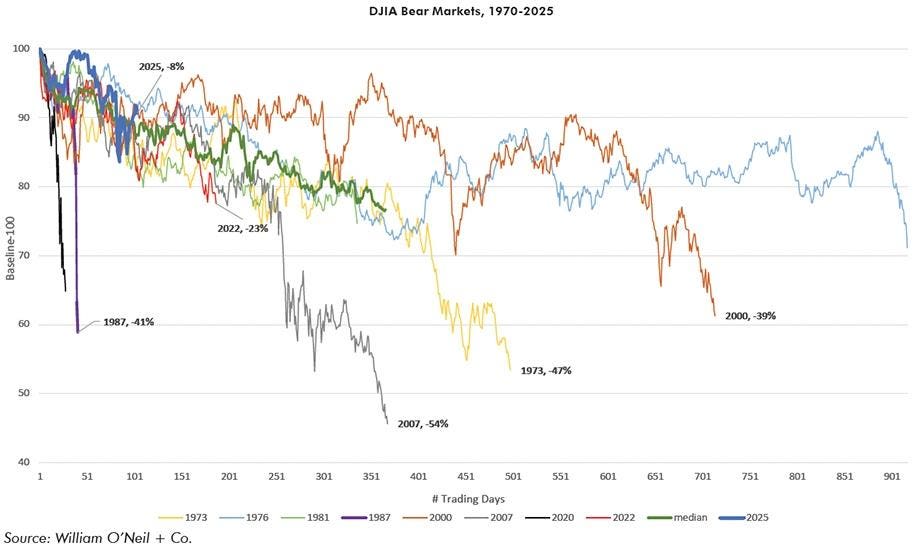
For historical purposes, we use the Dow Jones Industrial Average (DJIA) as our guidepost for market studies given the length of past data. Figure 1 shows all equity bear markets from 1970 to present. As seen in the top left corner of the chart, and represented by the blue line, the current percent from highs is only -8% after the recent rally. This is well below most past bear markets (at 105 days in) and raises the question if this is a true bear market or an unusually sharp correction within an ongoing bull market. The median percent down this far in is around 14%.Still, the trading sequence from highs is not that far off from the beginnings of bear markets, particularly 2000 and 2022.
Figure 1: DJIA Bear Market Sequences
But the case for a sharp correction and beginning of a new run is gaining momentum and appears to be the stronger one currently. Two cases where the deep correction led to lows being established fairly quickly and a new uptrend beginning were in 1998 and 2018. The Nasdaq’s current trajectory has looked especially similar to these two periods. The key to continuing on this path will be further gains with no correction of 5% or greater.
Figure 2/3: Comparison of Current Market to 2018 and 1998
See how the actual charts themselves compare in the next three pages. (3 charts)
Below in Figure 4 are the averages and medians of bull market rallies and corrections, versus bear market correction and rallies. This considers a “leg” of at least 5% in either direction as the minimum.
Figure 4: Average/Median Rally/Corrections Legs, DJIA 1900-2025
As you can see below in Figure 5, and starting with the last clear bull market leg, the recent legs in both directions have been mixed to the point of almost being indistinguishable. The current up leg is up roughly +10% from the low on April 21, which is in-line with up legs occurring within bear markets. We remain hopeful that the current leg continues higher without a >5% correction and begins to look more like the typical bull leg. This would be roughly another 4% higher and would take the DJIA to above its 100-DMA and back to within about 5% of all-time highs. A >5% pullback from here would not be ideal, as it would represent a clear undercut of the 21-DMA, something that did not happen quickly in 1998 or 2018. See the initial legs from the lows in 1998 and 2018 at the bottom of the table.
Figure 5: Recent Average/Median Rally/Corrections Legs
While we are encouraged by the recent three weeks of positive market action, we are not yet convinced that the market has returned to a sustainable long-term uptrend. One factor that leaves us a bit worried is the breakdown of leading and lagging O’Neil Industry Groups. In general, when a new bull market emerges, we would like to see clearly defined growth stocks in areas like Technology, Health Care, and Consumer Discretionary at the top of the group rankings and not more defensive industries like Gold, Tobacco, Utility, and defensive Retail. The number of more defensive groups within the top 40 industries concerns us and we would like to see more growth industries move into this list. But the early signs of improvement are there. Security and Gaming Software, Fintech (Financial Services and Payments), and Internet Retail are fertile growth areas now within the top 40.
Figure 6: Top and Bottom 40-Ranked Industry Groups
Kenley Scott, Director, Global Sector Strategist at William O’Neil + Company, an affiliate of O’Neil Global Advisors, made significant contributions to the data compilation, analysis, and writing for this article.
The William O’Neil + Co. Research Analysts made significant contributions to the data compilation, analysis, and writing for this article.
Disclaimer
No part of the authors’ compensation was, is, or will be directly or indirectly related to the specific recommendations or views expressed herein. William O’Neil + Co., its affiliates, and/or their respective officers, directors, or employees may have interests, or long or short positions, and may at any time make purchases or sales as a principal or agent of the securities referred to herein.
William O’Neil + Co. Incorporated is an SEC Registered Investment Adviser. Employees of William O’Neil + Company and its affiliates may now or in the future have positions in securities mentioned in this communication. Our content should not be relied upon as the sole factor in determining whether to buy, sell, or hold a stock. For important information about reports, our business, and legal notices please go to www.williamoneil.com/legal.
©2025, William O’Neil + Company, Inc. All Rights Reserved.
Read the full article here


 Will Accelerate Under President Trump")


