The November elections ushered in a new administration and a Republican sweep of the federal government with the party winning the White House, House of Representatives, and the Senate. Investors, investment bankers, and private equity have viewed the change in Washington as heralding a possible improvement in both mergers and acquisitions (M&A) activity as well as public equity issuance.
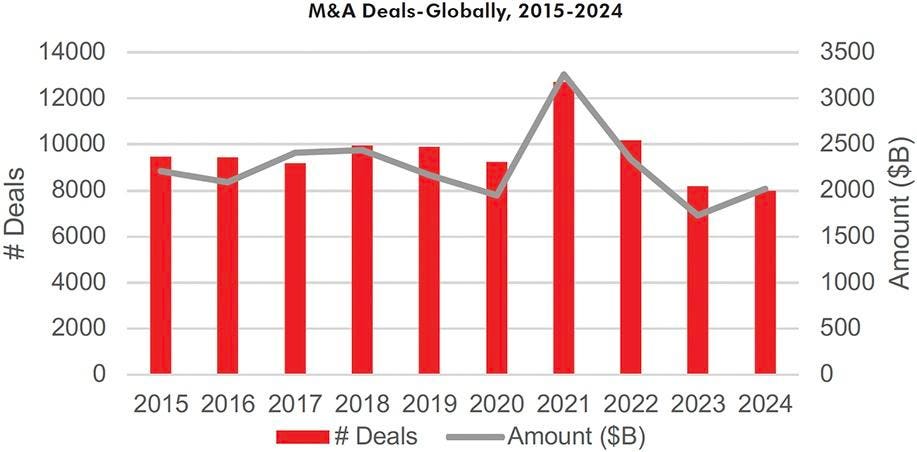
The Biden Administration, led by Gary Gensler, the chair of the Securities and Exchange Commission and Lina Khan, the commissioner of the Federal Trade Commission, has restricted both public offerings due to a higher regulatory burden as well as legally challenging an increased number of mergers and acquisitions. These two factors have chilled the deal environment over the last several years as shown below on the charts from Bloomberg.
Figure 1-2: M&A Deals Globally and in the U.S., Trailing 10 Years
In terms of initial public offerings (IPOs) in the U.S., the numbers are back on the rise after two slow years, although still well off the 2021 peak. This is important for investors as the number of public companies in the U.S. has fallen from a peak of 8,090 in 1996 to roughly 4,300 today. This has been offset by a spectacular rise in the number of owned or backed private equity (PE) companies. According to JP Morgan, PE sponsored firms have grown from 1,900 to 11,200 over the last 20 years. William O’Neil + Co. suspects that there is some level of pent-up demand both from investors for new offerings as well as companies waiting to go public. After a spike in 2021, the last three years have continued the trend of the last decade in terms of a low number of total IPOs versus history as seen on the two charts below.
Figures 3-4: U.S. IPOs and SPACs, Trailing 10 Years
Interestingly, Health Care has had the highest number of IPOs year-to-date followed by Capital Equipment and then Technology. Technology IPOs have been particularly weak as many companies have either raised money from venture capital, private equity or been acquired. If the IPO market reaccelerates over the next four years, we would expect a spike in Technology offerings led by the AI area.
Figure 5-6: IPOs by Sector and Technology IPO $ Amount
Remarkably, IPO related ETFs have had good price performance recently and we believe are signaling a better deal environment. Below are six Datagraphs® of IPO related ETFs. All have a positive slope and are trading above their 50- and 200-day moving averages.
Figure 7a and 7b: Daily/Weekly Mini Charts of IPO-Related ETFs
A forecasted pick up in IPOs and secondaries would also likely coincide with an improvement in the relative performance of small capitalization companies. Small cap companies have greatly underperformed their large cap brethren over the last four years. The recent improvement in small cap price performance may create an opportunity for companies to raise money. Also, a stronger U.S. economy combined with a better deal cycle could lead to small cap outperformance. Figures 8 and 9 show that both primary and secondary equity offerings are up versus the past two years, but still less than half of the 2020/2021 annual total.
Figures 8-9: Number and Dollar Amount of U.S. Equity Offerings, Trailing 10 Years
Finally, a major beneficiary of an improved M&A and equity offering cycle would be the U.S. investment banks. Many of these stocks have emerged in the second half of the year to be market leaders. Below is the weekly Datagraph of the investment bank O’Neil Industry Group, which is enjoying a strong period of price leadership. While extended in the short term, investment banks are clearly a leading group and a profitable area for finding individual stocks. Some stocks to consider with high Relative Strength ideas include Jefferies Financial Group (JEF), PJT Partners (PJT), Raymond James Financial (RJF), Lazard (LAZ), Piper Sandler Companies (PIPR), Evercore (EVR), Houlihan Lokey (HLI), and Perella Weinberg Partners (PWP). We would encourage investors to do more research on these names for possible inclusion in the portfolios.
Figure 10: Weekly Chart of O’Neil Investment Bank/Broker Industry Group
Kenley Scott, Director, Global Sector Strategist at William O’Neil + Co., made significant contributions to the data compilation, analysis, and writing for this article.
Disclaimer
No part of the authors’ compensation was, is, or will be directly or indirectly related to the specific recommendations or views expressed herein. William O’Neil + Co., its affiliates, and/or their respective officers, directors, or employees may have interests, or long or short positions, and may at any time make purchases or sales as a principal or agent of the securities referred to herein.
William O’Neil + Co. Incorporated is an SEC Registered Investment Adviser. Employees of William O’Neil + Company and its affiliates may now or in the future have positions in securities mentioned in this communication. Our content should not be relied upon as the sole factor in determining whether to buy, sell, or hold a stock. For important information about reports, our business, and legal notices please go to www.williamoneil.com/legal.
©2024, William O’Neil + Company, Inc. All Rights Reserved.
Read the full article here

